Context is everything
We give you the most information about your Ruby errors so you can find them, fix them and make sure they don't happen again.
We give you the most information about your Ruby errors so you can find them, fix them and make sure they don't happen again.
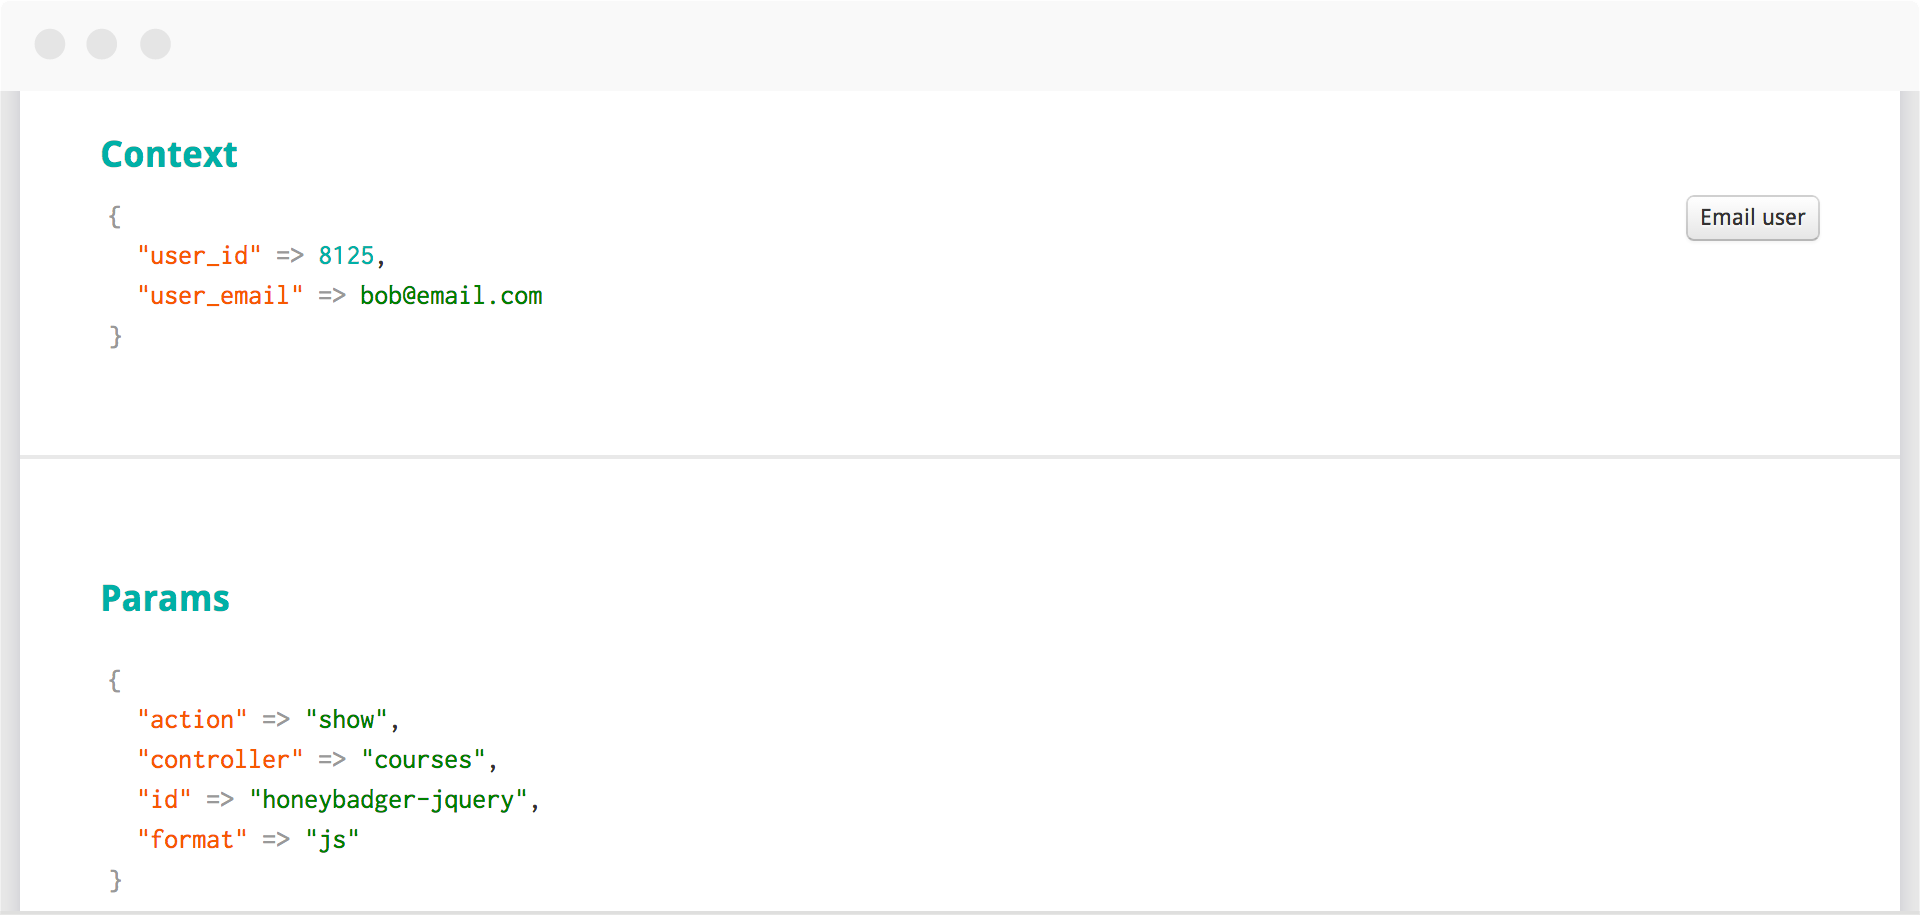
Params, cookies, local variables...You get the most complete picture of the bad request so you can duplicate it in your development environment and test suite.
Normal backtraces are nice. But our backtraces are git and rails-aware. They can take you to the exact revision, file and line in github. And they can open the file in your local editor.
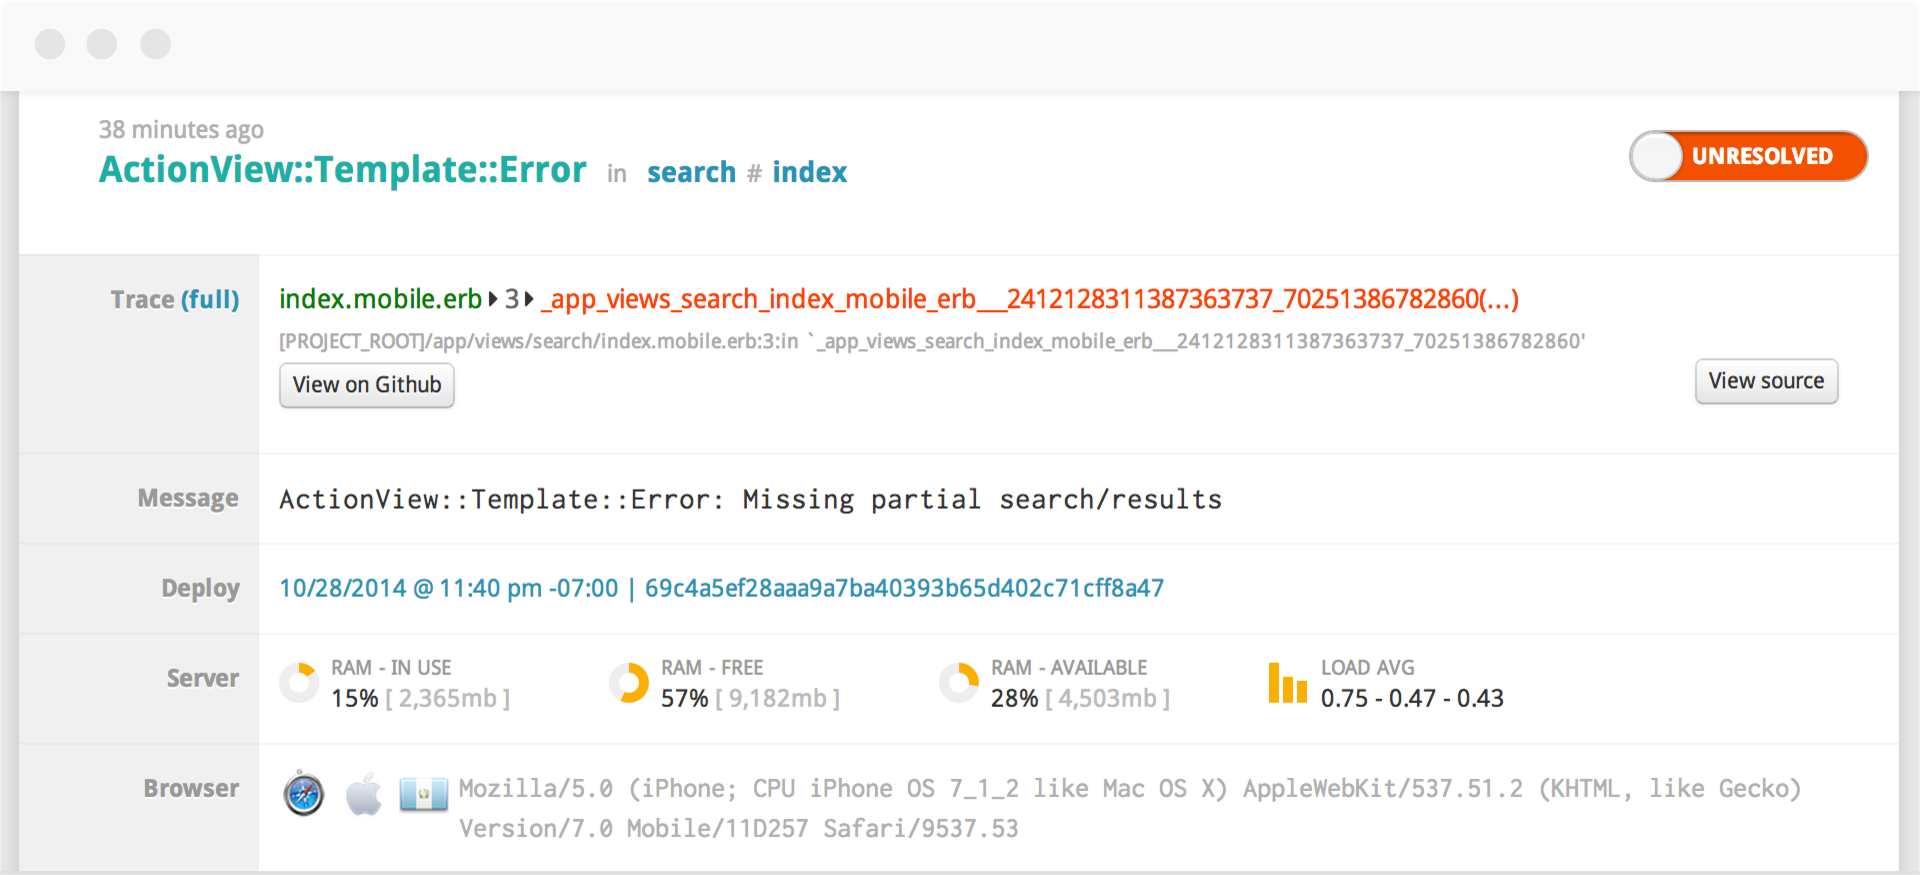
We keep a record of all your deploys, and will notify of error re-occurrences that happen after a deploy.
Get a 360-degree view of requests that cause exceptions, and the state of the application when those requests were made.
We capture and display the kind of information your apps deal with when responding to a request.
When you enable local variable tracking, we'll take a snapshot of your stack whenever an error occurs and attach the local variable info to the error.
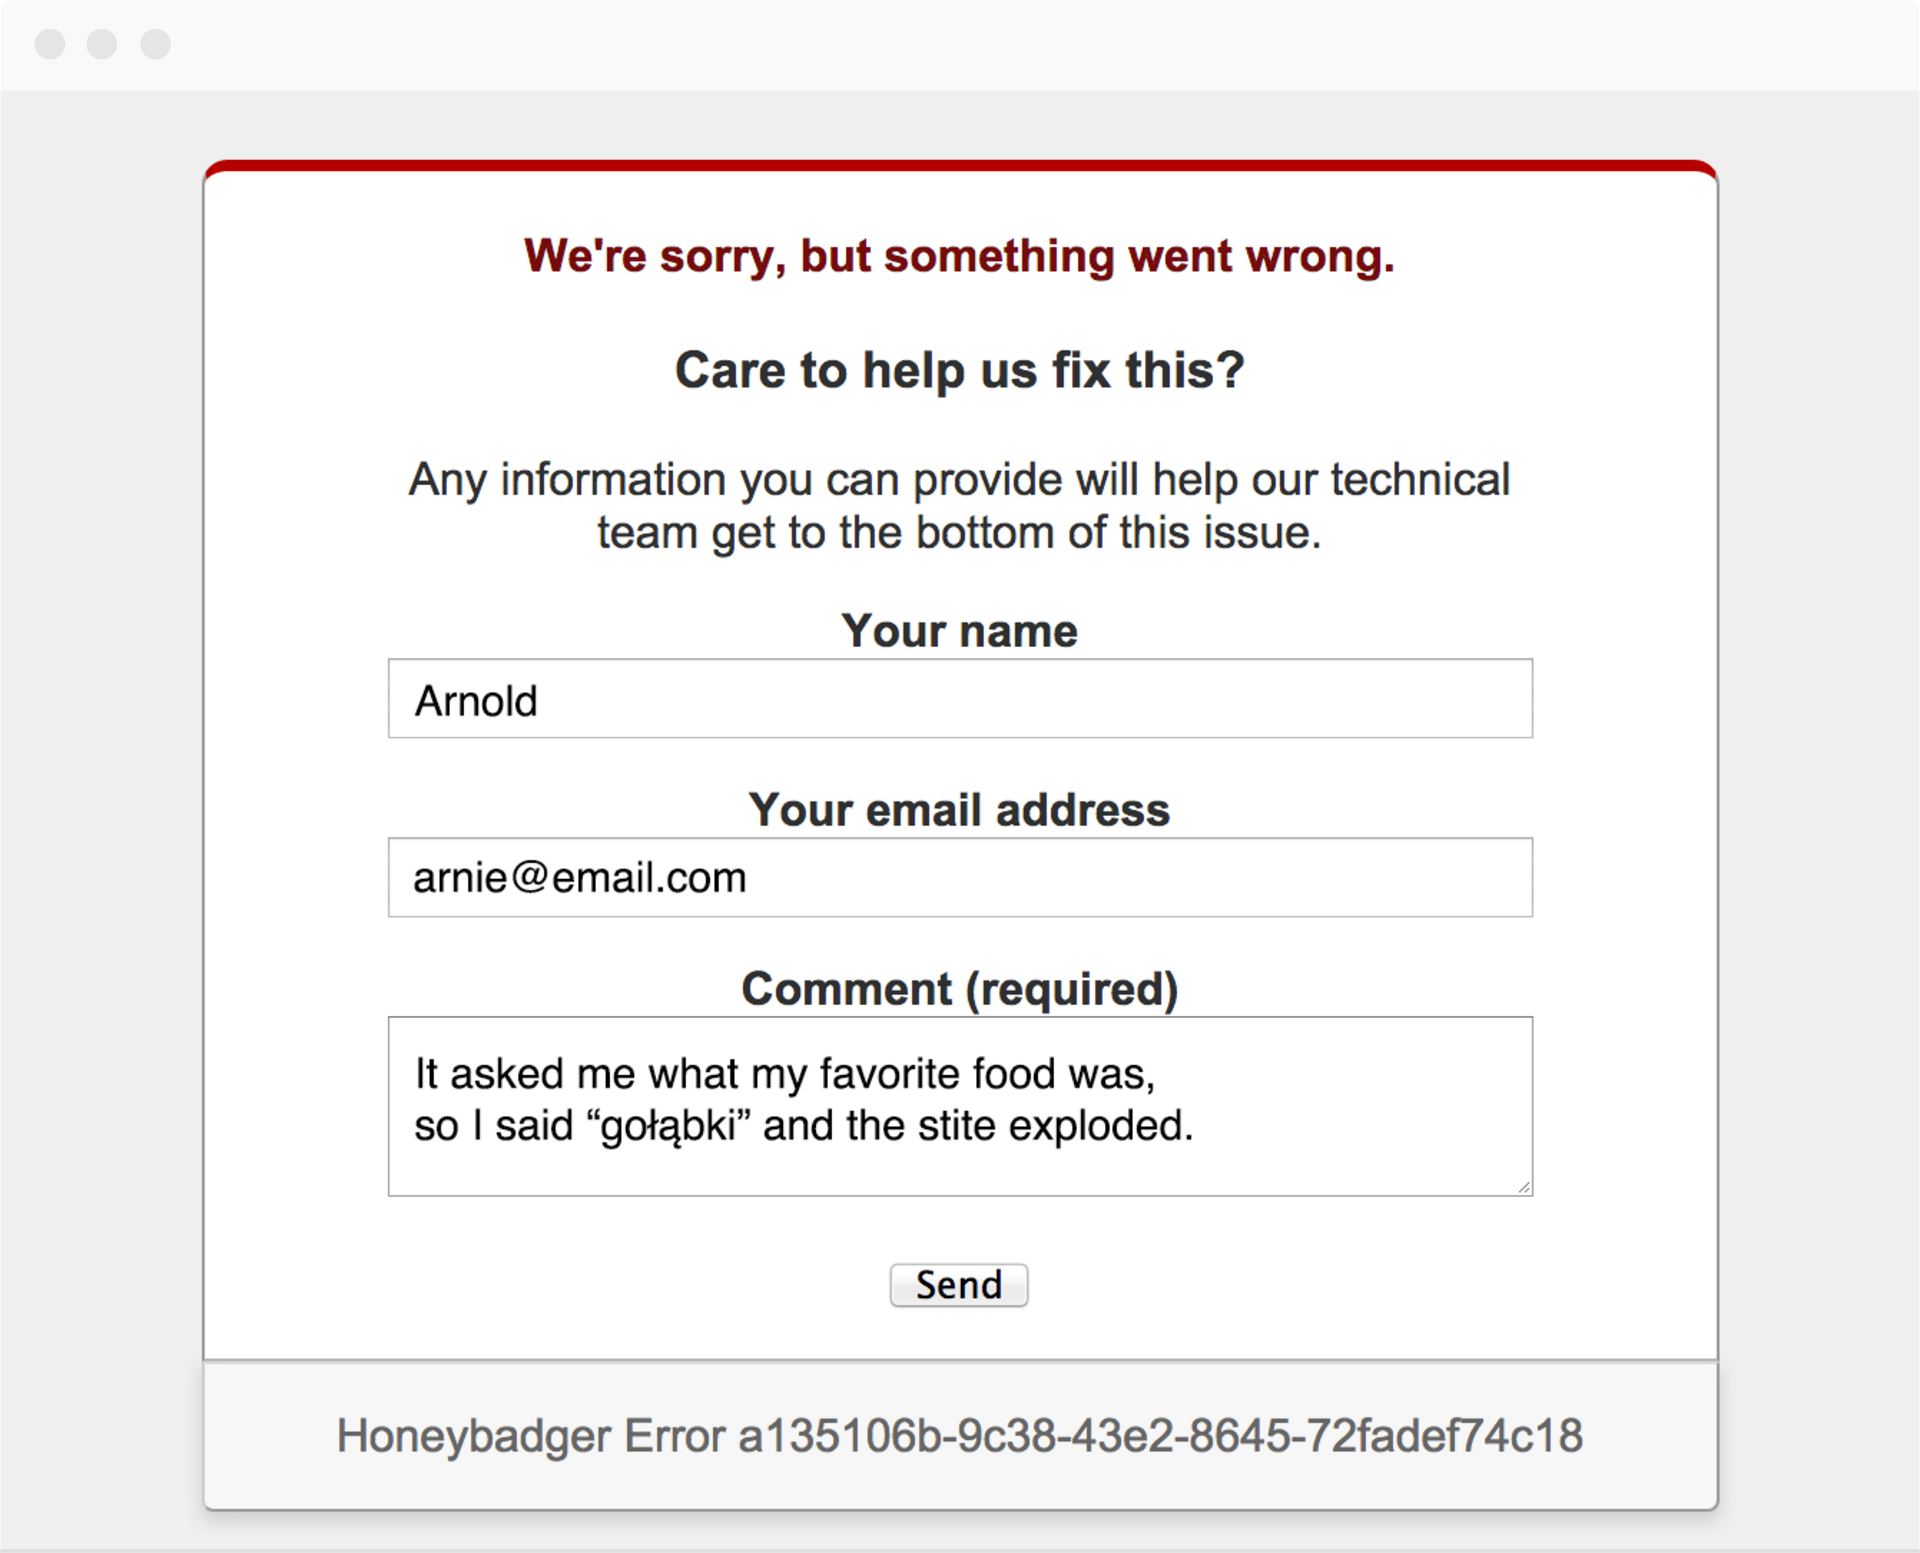
Drop a single line of code into your error template and you'll get a user feedback form asking the user for details about the error. Their responses are attached to the error itself.
We help you take the friction out of debugging by automating the repetitive tasks you do every time there's an error.
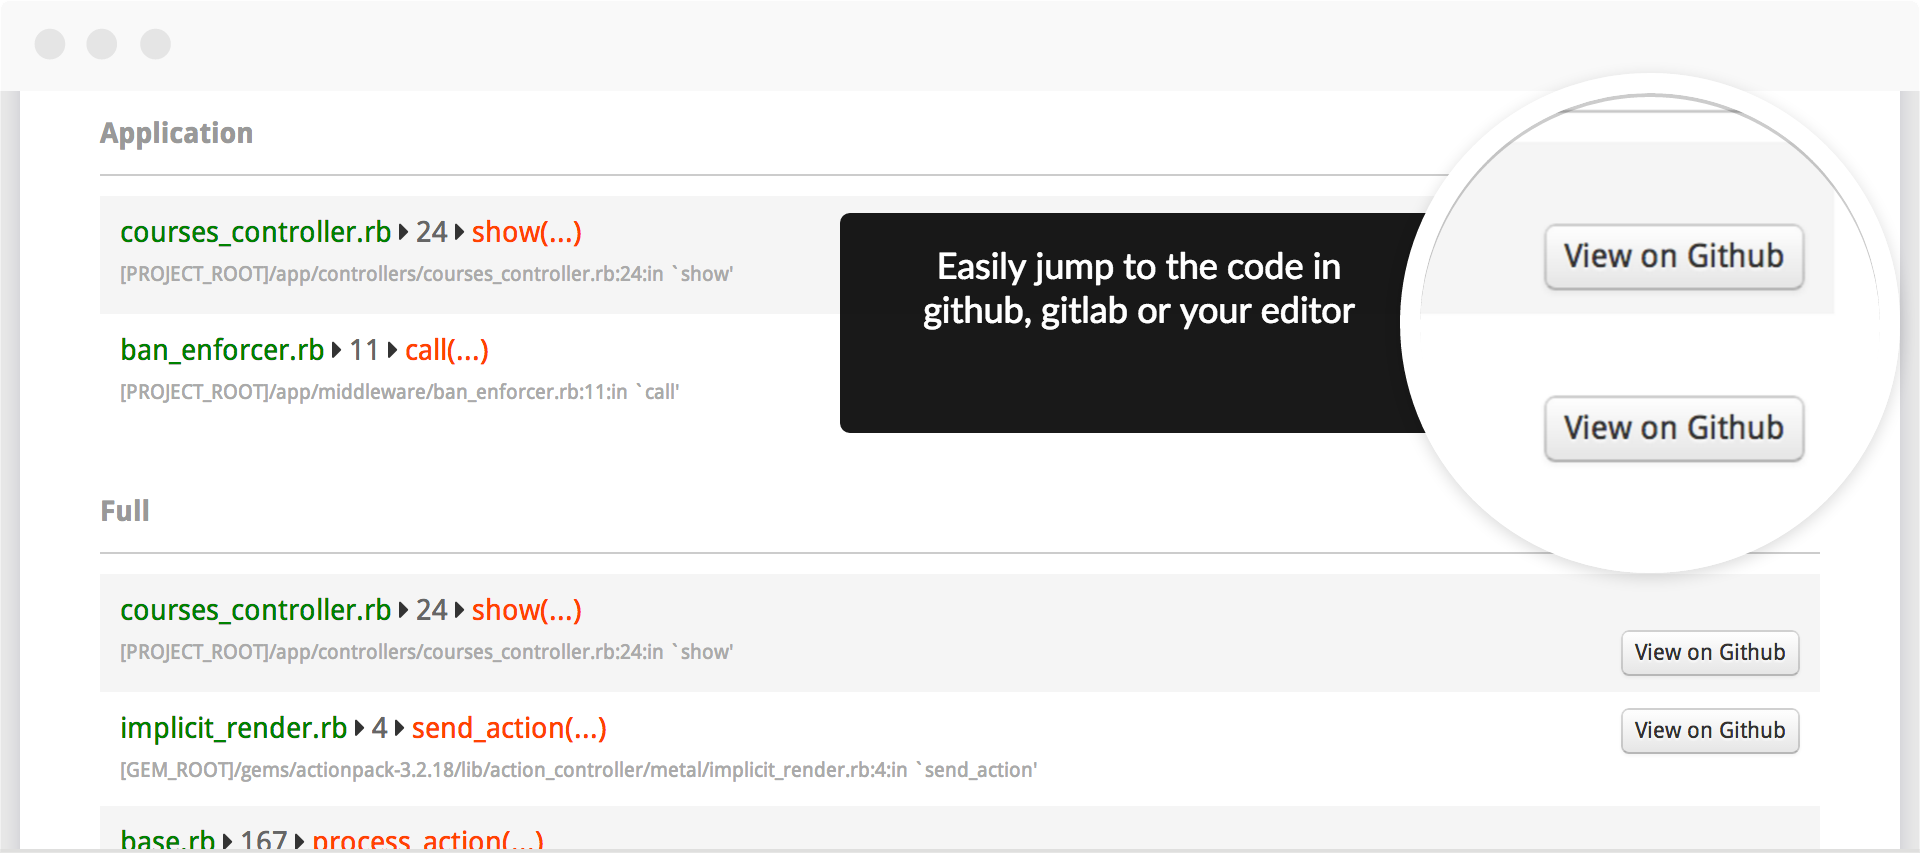
With one click you can jump from the trace to the code in github. And we keep track of which revision caused an error so you'll go to the right code even if the error happened a month ago.
You usually don't need to see the 100 lines of Rails backtrace. You just need to see which parts of your code were involved. We present these as a separate application trace.
With one click you can open a file in vim, sublime text, or other editor.
Because we're built for Rails, we can do things the other guys can't. Like collecting error feedback from your users.
We group instances of the same error together and give you an easy way to browse them. Because 10,000 exceptions shouldn't equal 10,000 emails.
You can do full-text search by error class, message, url, as well as metadata that you optionally provide, like user id.
Development, production, staging. Honeybadger knows about them and lets you search by environment, set different notification rules for different environments and more.
We have the flexibility to let you handle errors in whichever way is most appropriate to your app, but also to pass along the debug data that makes sense for you.
Do you ever want to log an error, but don't want the exception to interfere with your user's experience? With Honeybadger, that's a breeze.
A lot of the time minor glitches don't raise exceptions at all. You can still report these to Honeybadger, with your own custom error messages.
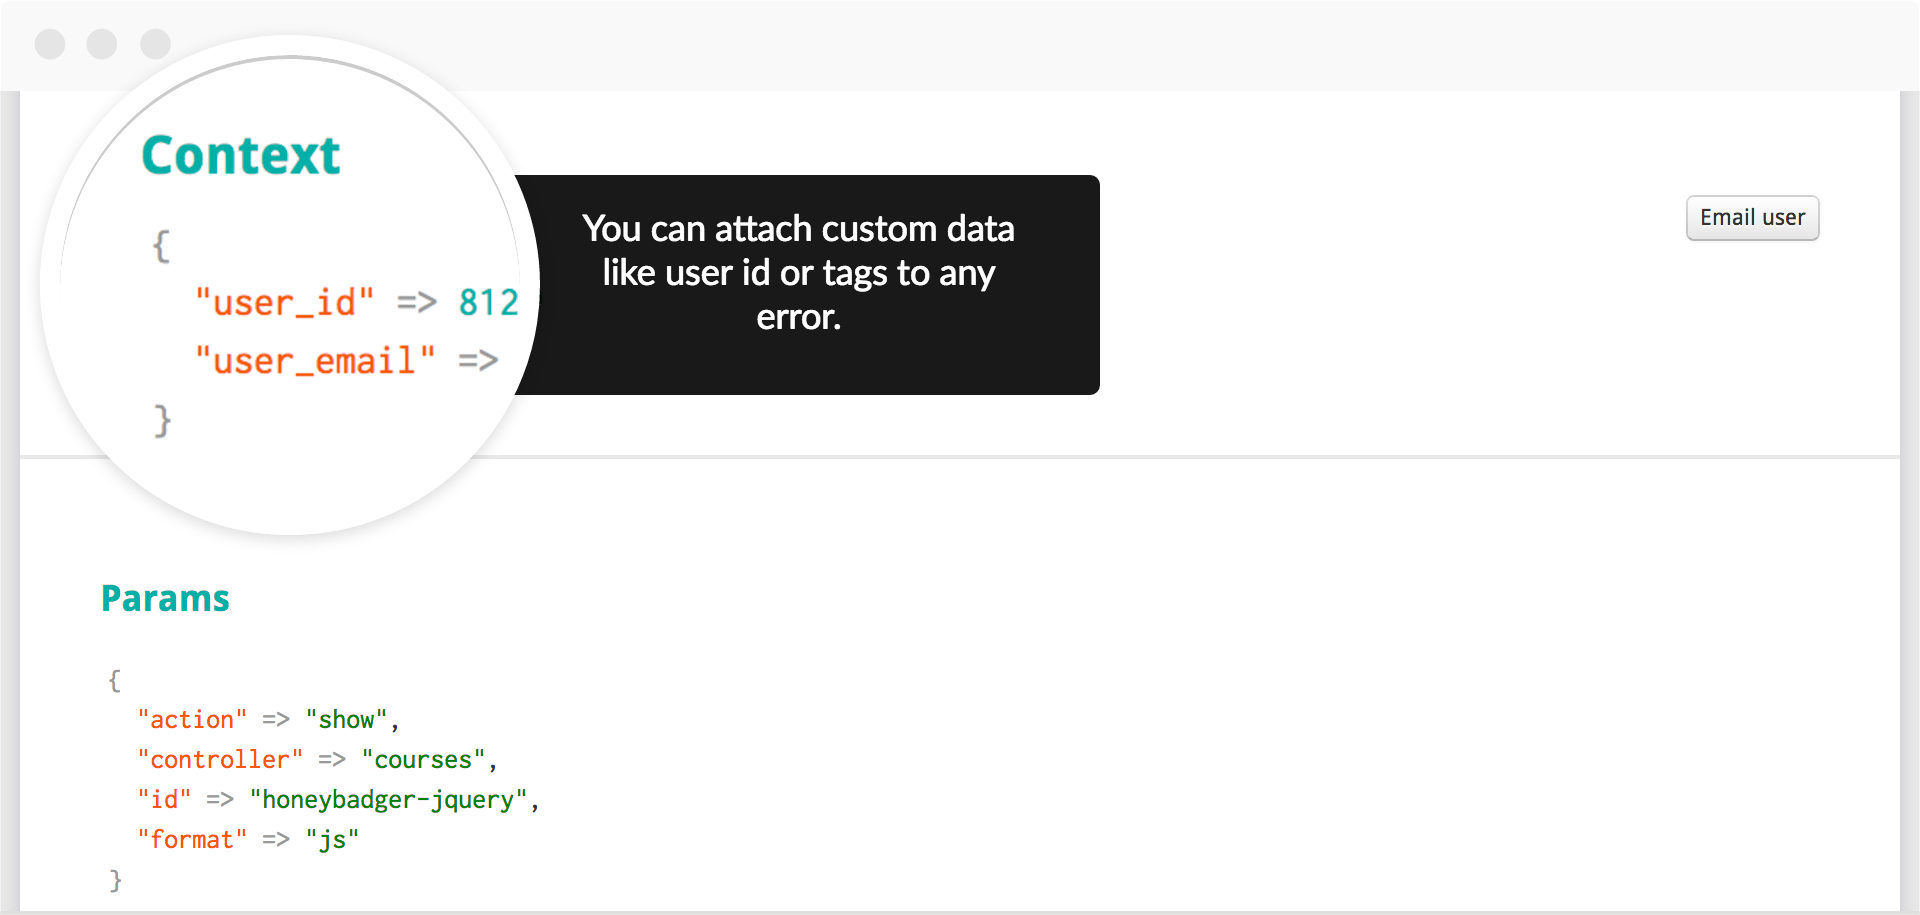
Knowing *who* caused an exception is often the difference between fixing it in a minute or an hour. We let you attach any data you like to your exceptions.
